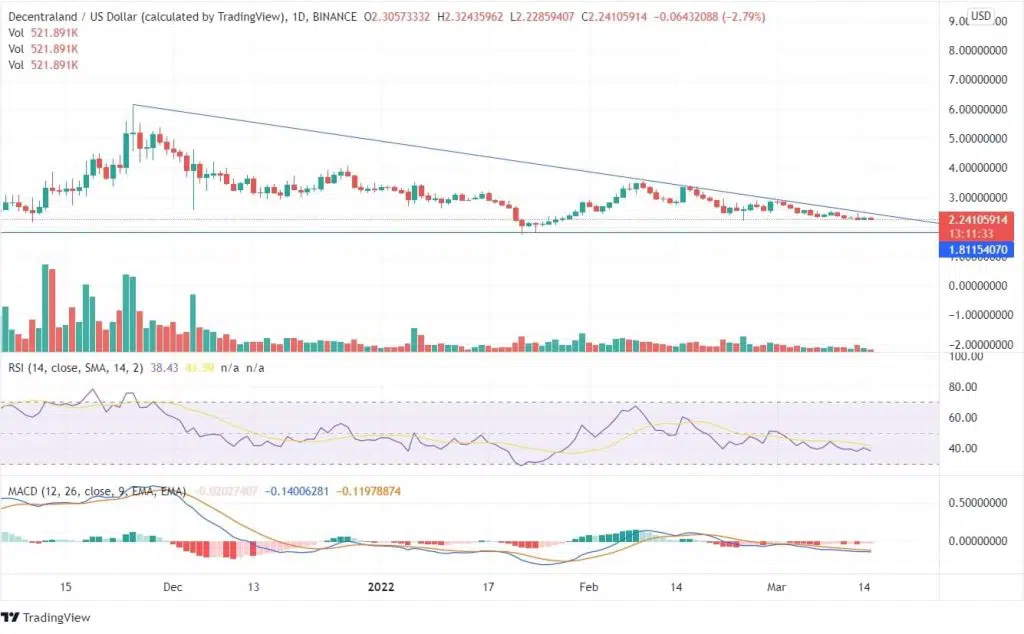
Decentraland was at its all-time high of $5.90 during November, after which the coin has been moving down towards its oversold zone. The coin has been moving below the downtrend line, and though the price got tested on February 16 but couldn’t cross. The MANA price is heading towards the support line of $1.83, after which it may recover and trade upwards.
In the past few days, the token shows the mixed price trend. Decentraland token has been recorded a massive correction over the past three months. The token price couldn’t cross the $3.5 mark and continued to decline.

On the daily chart, the MACD line being below the signal line and the histogram chart showing red candles denotes a bearish signal. The RSI indicator being 37 is currently neutral but may head towards the oversold zone. On March 13, the bulls tried to push the price up but couldn’t close nearby to highs, and the swing high was formed. Based on the Decentraland price prediction, once the price closes above the peak of $3.4 and the downtrend line, a bullish momentum can be expected. However, if the coin closes below $1.7, a downside trend can be expected.
On the weekly chart, there has been the continuous formation of bearish candles with a constant downfall of price. The recent forming candle below the trend line shows the bears are still pushing the price down. The traders in the sell trade can expect the price to reach its lows of $1.7.